So Lisa and I ran a very, very casual survey of storytime providers and she’s already written two great posts looking at the results, one about numbers of non-storytime programs per week and one about taking breaks.
I am finally catching up to her by giving us a look at the big numbers, the prime motivation for the survey: how many storytimes do we do on average every week?
So our survey divided out responders by how many hours a week they work overall, then asked how many storytimes they do on an average week. This was a quick and dirty set of questions and the numbers should be taken with a grain of salt as a result. We didn’t give specific instructions, so some people included their outreach events and some people didn’t; some people have a very regular weekly schedule, and some people don’t and kind of had to punt to give us a weekly number.
HOWEVER!
As of today, we have 130 responses all together, and here’s what we have:
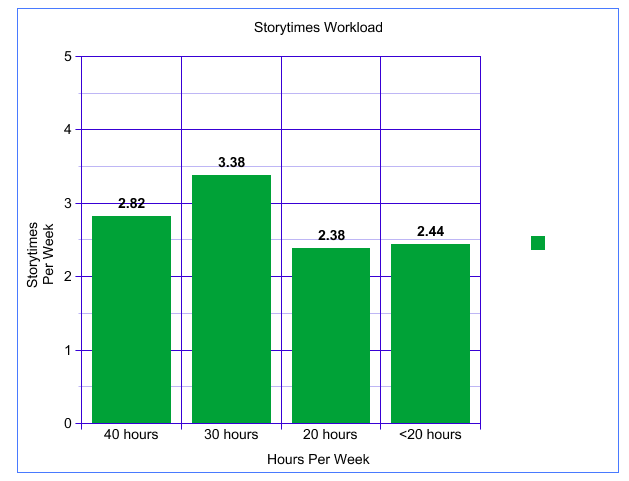
PS I made this chart at http://nces.ed.gov/NCESKIDS/createagraph/default.aspx !
For 40 hour/week staff, the average storytimes per week was 2.82 (94 respondents)
For 30 hour/week staff, the average storytimes per week was 3.38 (8 respondents)
For 20 hour/week staff, the average storytimes per week was 2.38 (21 respondents)
For <20 hour/week staff, the average storytimes per week was 2.44 (9 respondents)
I thought it was interesting that the average for all staff was 2-3 per week (with a little bump for those few 30 hour folks, go you guys!)–given we had staff from small libraries *and* big libraries respond, and staff with varying levels of non-storytime responsibilities (though we didn’t have a way to track that, it came through anecdotally in the comments).
It certainly looks like there is a sweet spot here. Not only the averages, but the modes were right at 2-3 per week, too. What do you think? Is this what you expected to see?
Added later 3/27: I forgot to say that what was also interesting to me was that it didn’t matter how many hours a week you worked; the number of storytimes stayed about the same. This means though that percentage-wise, storytimes are filling up proportionately more of your week if you are part time than if you are full time. I wonder if this is an expectation reflected in job descriptions?
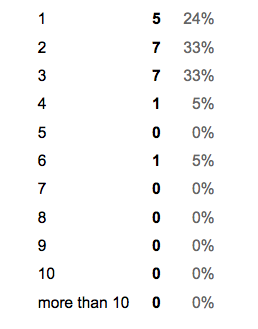
PS: Here are the raw numbers–Google didn’t give me tidy charts so read the captions carefully!
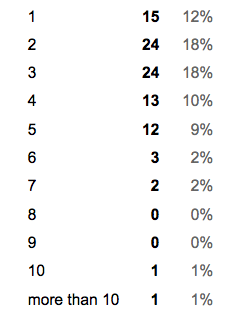
Storytime Per Person at 40 Hours a Week: First Column # of Storytimes, Second Column # of Responders
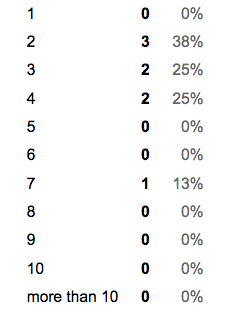
Storytime Per Person at 30 Hours a Week: First Column # of Storytimes, Second Column # of Responders
Storytime Per Person at 20 Hours a Week: First Column # of Storytimes, Second Column # of Responders

Storytime Per Person at less than 20 Hours a Week: First Column # of Storytimes, Second Column # of Responders

.jpg)

7 Responses to Storytime Workload Survey: THE NUMBERS