
I am looping back around one more time to the Storytime Workload Survey, even though time and tides and you guys have marched on long since. We are knee-deep in a major staffing reorganization at my library and my time management this month has been dicey, but there’s one more set of questions I wanted to talk about, so here you go and apologies for the delay!
As a quick recap, Lisa and I threw together the quickest survey ever on storytime workloads, and between the two of us we’ve responded to the questions about breaks, numbers of storytimes per week, prep time, the impact of single v. multiple preps per program, and amount of other programming, here and at Libraryland.
The last two questions in the survey were thought experiments. With our upcoming staff reorganization on my mind, I was wondering if there were any way to gauge how many storytimes is too many to assign to one person. This really is an impossible question, I know, because the energy required to present storytime lands on different people in different ways, and we will never be free of other responsibilities that crowd our minds and demand our time and attention. However, at my library we are now in a position to streamline our storytime providers’ responsibilities SOMEWHAT, and given that change, naturally I wondered if that would make a difference in how many storytimes per week would now feel comfortable and do-able to the staff.
We asked this:
Einstein-esque Thought Experiment: Say you worked in a community that could support an infinite number of storytimes per week, and that you were on the team that provided them all, and were provided with the time & resources you needed for planning and prep, and you had no other responsibilities to worry about until storytimes were covered. How many storytimes could you personally present each week without running out of steam?
The intent was to TRY to assess a raw energy level, a humane set of expectations around this complex library service…I did not want to take my own personal experience as the baseline.
So, what were the responses?
The pie chart we got from Google forms is pretty useless, so here is the raw data. This week we are at 143 responses (up from 130 at the end of March). My caption should read “storytimes each week.”
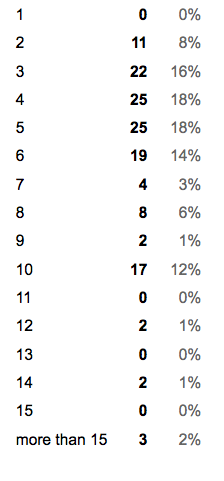
How many storytimes would you have energy for given no other responsibilities?
The highest watermark here is pretty evenly at 3-6 storytimes per week, with the lower peaks at 2, 7, 8, and 10 storytimes per week. Also, if you are one of the 3 people who marked down “more than 15” I would like to shake your hand.
How do these numbers feel to you? I think it’s interesting to compare these results to the actual number of storytimes most of the survey responders do per week, since it indicates that on the whole (overall! broadly speaking!) in ideal situations we could probably sustain more storytimes than we currently do.
Now, stay tuned for tomorrow, when I post the second half of the Thought Experiments, and you can see how different the second question turned out from the first!

.jpg)
